The goal of InfoVis for AI Explainability is to design, develop, and evaluate visualization techniques for solving real-world data problems and gain hands-on experience in prototyping visualization designs. This is a course designed and instructed by Dr. Jian Zhao.
VD1: Hello, D3! is a project that includes two visualizations interactively linked together, each encodes three variables of the Income Evaluation Dataset. When a user hovers over a circle in the scatter plot, the corresponding rectangle in the bar will be highlighted, and vice versa. The page is built with HTML and encoded JavaScript. Both visualizations are rendered at real-time by reading the CSV file containing the dataset and making needed calculations.
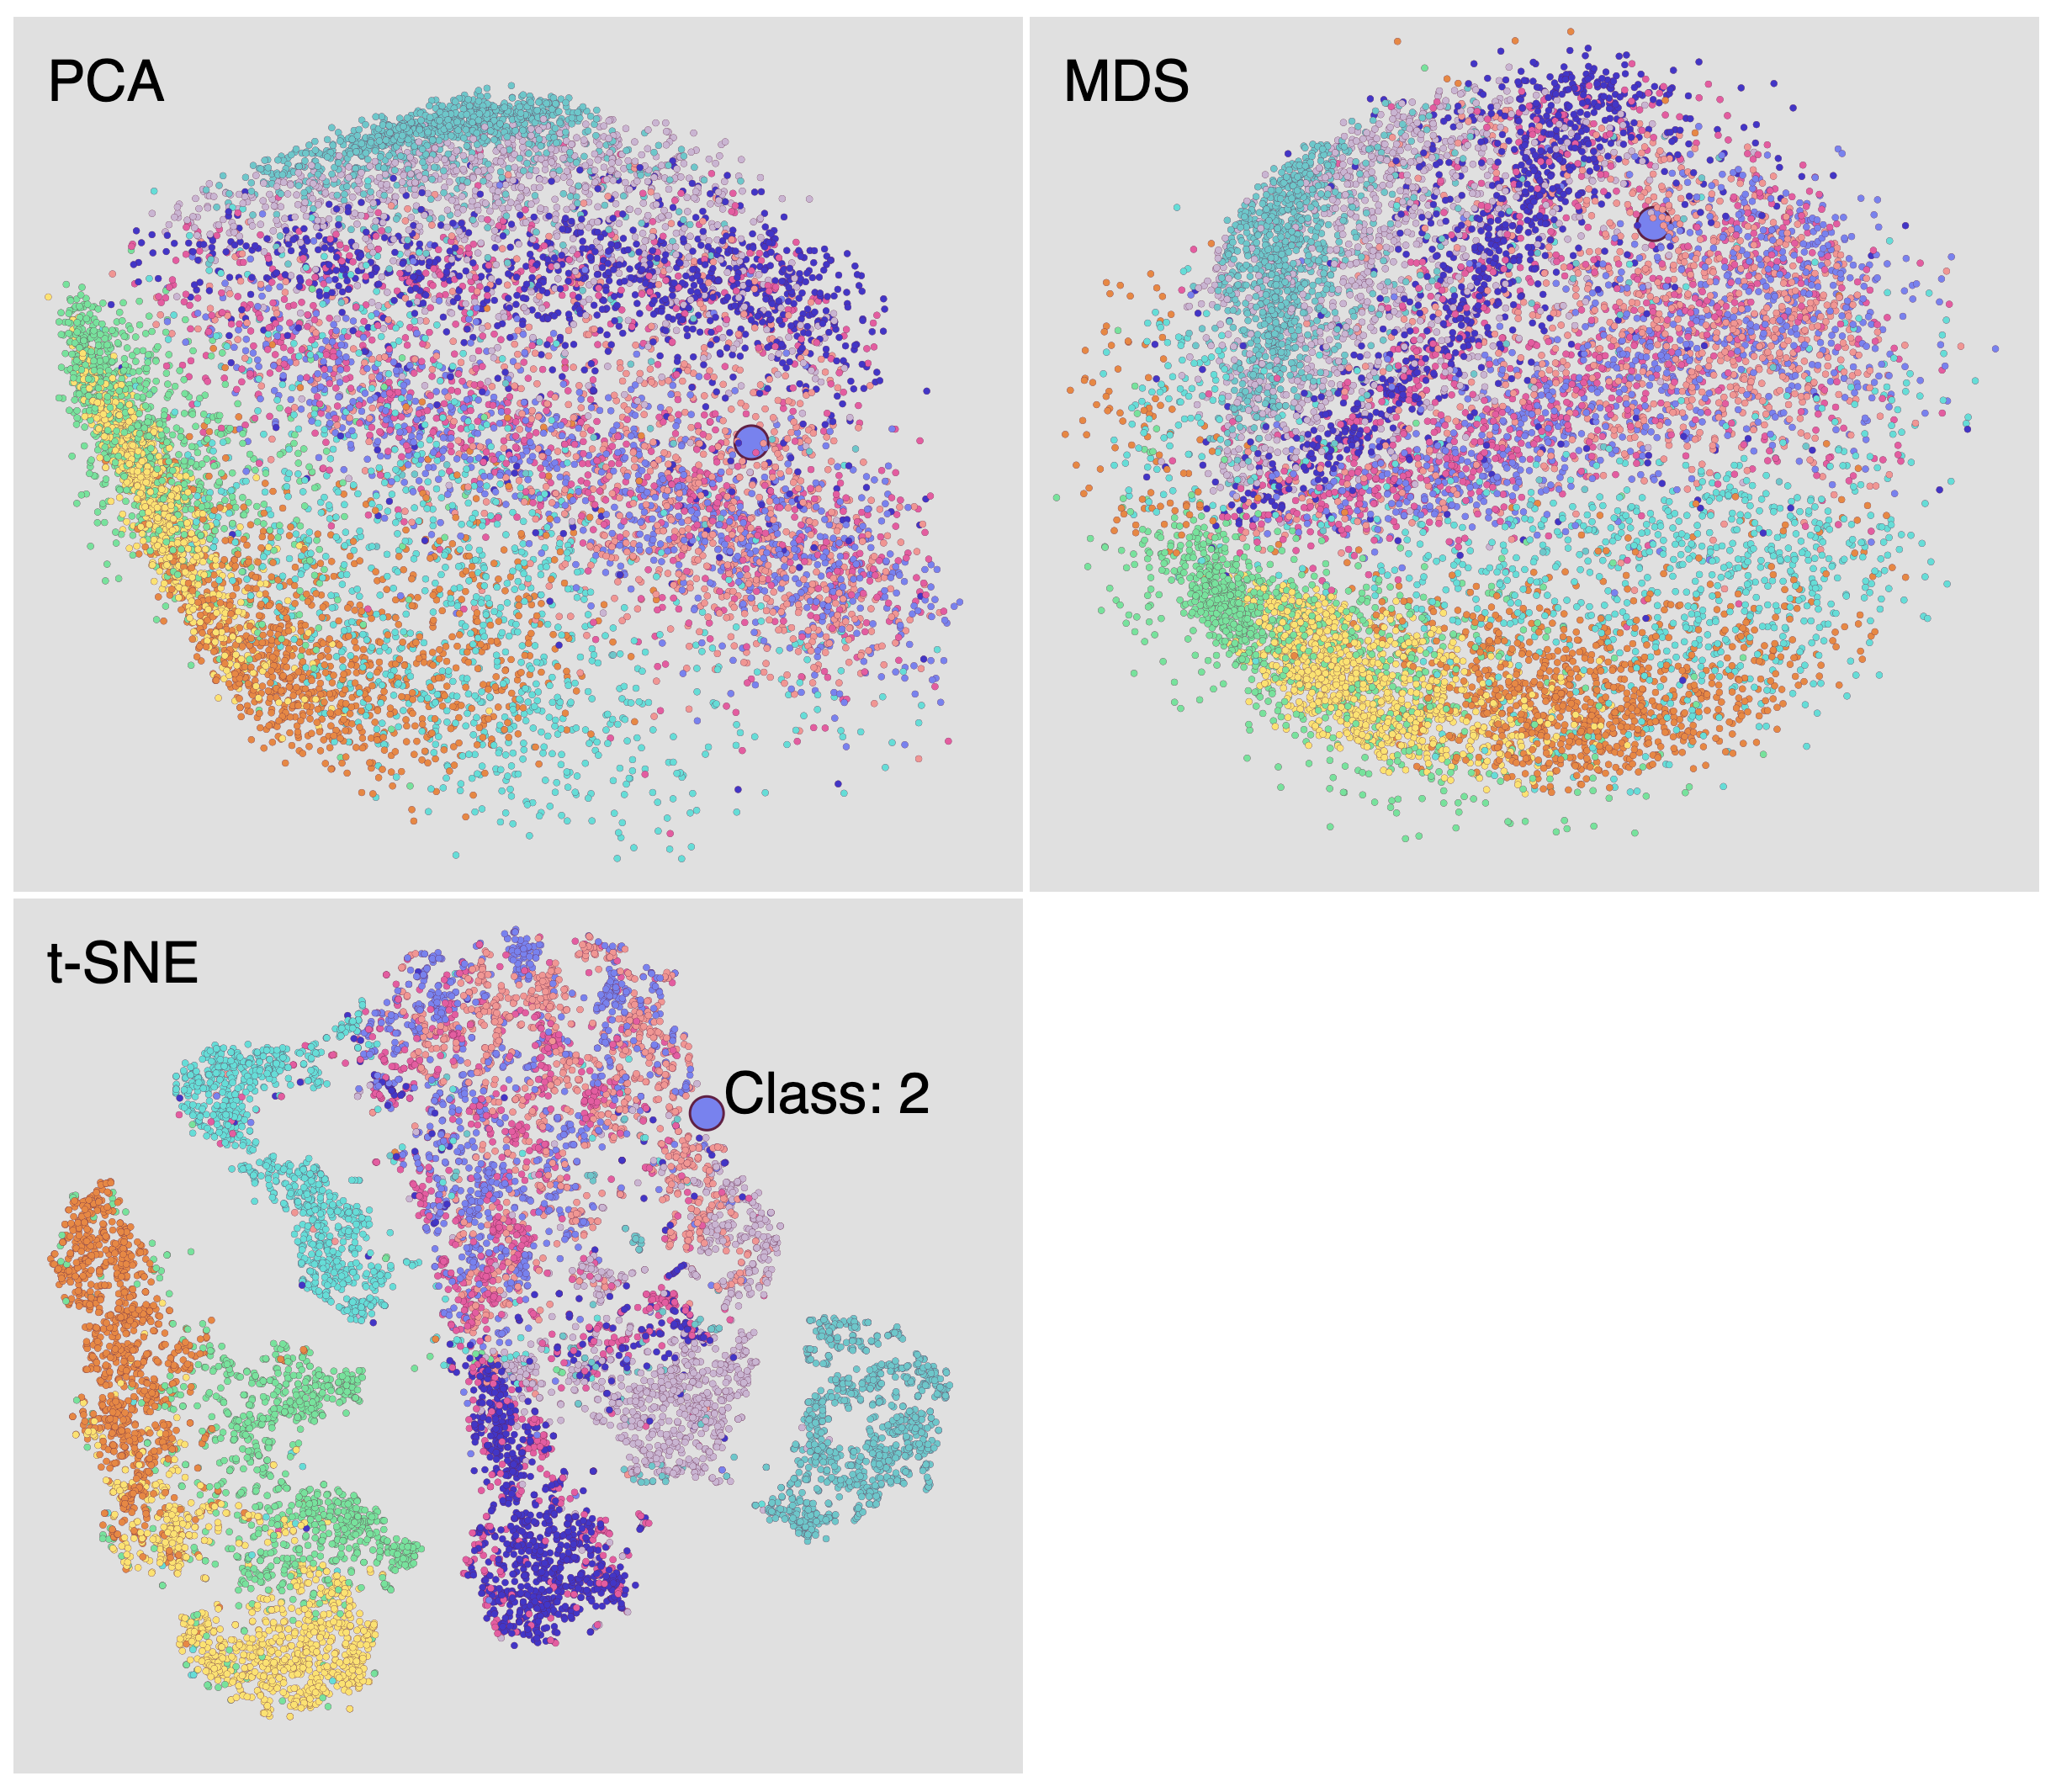
VD2: Dimensionality Reduction is a project that applies various dimensionality reduction methods, including PCA, MDS, and t-SNE to the 10,000 test set of Fashion MNIST by projecting the high-dimensional data points onto a 2D plane. Python is used to pre-process the data and generate the projected coordinates, and the resulting visualizations is linked interactively as hovering over one dot in one visualization will highlight the corresponding dots in other visualizations. This is a NodeJS-based web app that can run on a local server.
VD3: Adjacency Matrix v.s. Node-Link Diagram is an implementation of an animated transition between a node-link diagram and an adjancency matrix based on the Les Miserables Network Dataset. Clicking a button will initiate an animated sequence in which the nodes of the node-link diagram will transition into the IDs of the characters and the resulted adjacency matrix will fade in.
- SkillsHTML, JavaScript, D3, NodeJS, sklearn, pytorch
- Source VD1github.com/yyou22/D3-Linked-Graph
- Source VD2github.com/yyou22/D3-Dimensionality-Reduction
- Source VD3github.com/yyou22/D3-Animated-Transition
- KeywordsHCI, Data Visualization, AI Explainability, Machine Learning